
A 145-year empirical analysis suggests that asset price surges are most dangerous when they are associated with rising financial leverage. The combination of housing price bubbles and credit booms has been the most detrimental of all. This bodes ill for modern leveraged housing price booms, such as in China.
Jordà, Òscar, Moritz Schularick and Alan M. Taylor (2015), “Leveraged Bubbles”, NBER Working Paper 21486, National Bureau of Economic Research. August 2015.
http://economics.ucdavis.edu/people/amtaylor/files/w21486.pdf
The below are excerpts from the paper. Headings and cursive text have been added.
Bubble basics
“The term “bubble” is typically used when asset prices deviate from their fundamental value in an asymmetric and explosive way, often in conjunction with a subsequent crash. Bubbles can occur even if investors have rational expectations and have identical information, so-called rational bubbles, but also under asymmetric information, in the presence of limits to arbitrage, and when investors hold heterogeneous beliefs.”

“There are two categories of bubbles. Pure, unleveraged ‘irrational exuberance’ bubbles may pose a limited threat to financial stability or the macroeconomic outlook. ‘Credit boom bubbles,’ on the other hand, may be a dangerous combination. In such bubbles, a positive feedback develops that involves credit growth, asset prices, and increasing leverage.”
On patterns indicating asset price bubbles view post here.
On the role of unrealistic pro-cyclical expectations in asset price bubbles view post here.
“Asset price bubbles and credit booms may be harmful, but the interaction of the two sows the seeds of severe economic distress. The risk of a financial crisis then rises substantially and the ensuing recessions are considerably more painful.”
A long-term global empirical analysis
“Financial crises and asset price boom-busts are relatively rare events. Thus, any empirical study must employ very long time series and the historical experience of more than one country.”
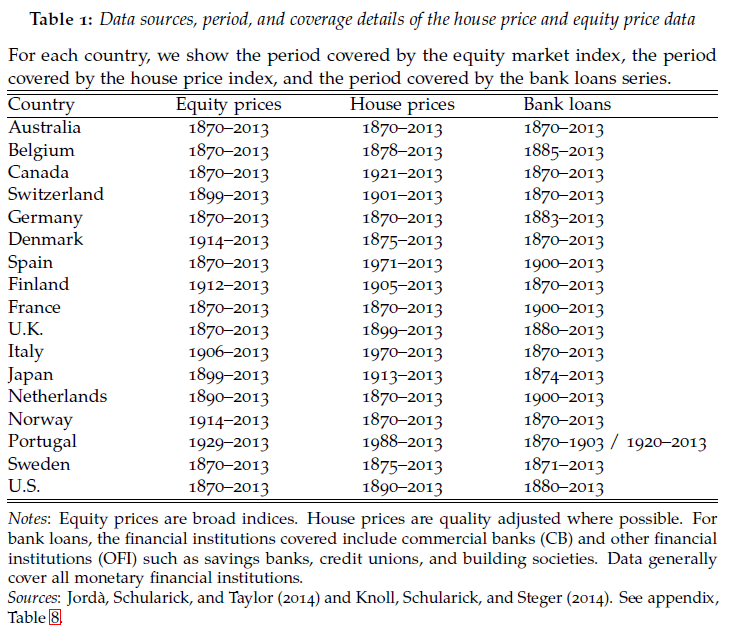
“Our study relies on…the latest vintage of our long-run credit and macroeconomic dataset in the form of an annual panel of 17 countries since 1870. To study asset price booms we have then added equity price data [and]…house prices…[The table below] gives an overview of the underlying data we use for housing prices, stock market prices, and bank lending. The combined data now include observations up to 2013.”
The key empirical findings
“Our key result is that some bubbles matter more than others. What makes bubbles dangerous is the role of credit… We demonstrate that it is the interaction of asset price bubbles and credit growth that poses the gravest risk to financial stability. These results, based on long-rung historical data, offer the first sound statistical support based on large samples for the widely held view that the financial stability risks stemming from of an unleveraged equity market boom gone bust (such as the U.S. dotcom bubble) can differ substantially from a credit-financed housing boom gone bust (such as the U.S. 2000s housing market).”
“We showed [in previous research] that the debt overhang from credit booms is an important feature of the business cycle and that it is associated with deeper and longer lasting recessions…Analyzing the consequences of bursting asset price bubbles for the macroeconomy, we show that the output costs in the depth of the financial crisis recession, and the speed of the subsequent recovery, are shaped by the interaction of asset price run-ups and the pace of credit growth in the prior boom phase.”
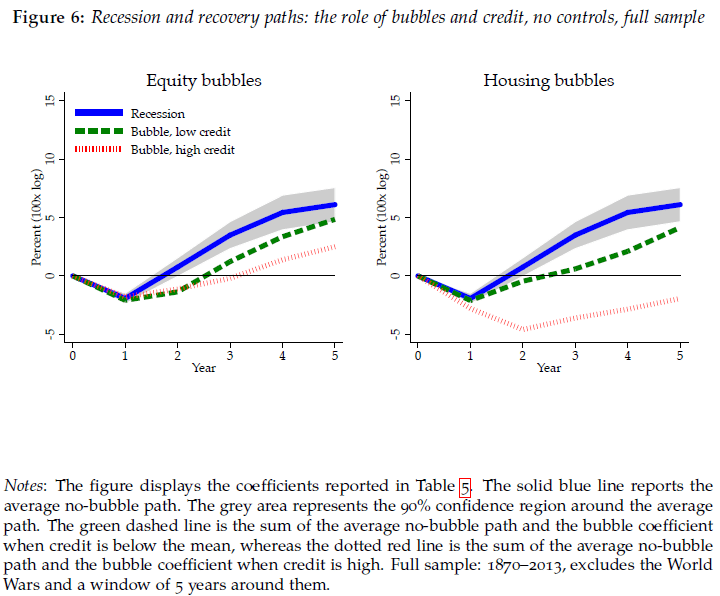
“Leveraged housing bubbles turn out to be the most harmful combination of all… they are considerably more damaging events. The drag on the economy is more than twice as big as with equity bubbles in cases accompanied by higher than average credit growth. In terms of the path of the recession and recovery, we note that it can sink the economy for several years running so that even by year 5 real GDP per capita is still below the level at the start of the recession.”
“These results can be more easily visualized in [the figure below]. The left-hand side panel shows the average path of real GDP per capita of the no-bubble economy along with the average path when there is an equity bubble and below/above average credit growth, and the right-hand side panel shows a similar chart using the housing bubble indicator instead.”
The surge in global credit
“One of the most striking features of the era of modern finance has been the surge in bank lending (as a ratio to GDP) in advanced economies following WW2… Rapid expansion of credit has subsequently been associated with a higher likelihood of experiencing a financial crisis recession.”
“The trends in long-run bank lending are well known by now: after an initial period of financial deepening in the late 19th century the average level of the credit-to-GDP ratio in advanced economies reached a plateau of about 50% on the eve of WW1. Subsequently, with the notable exception of the deep contraction seen in bank lending in the Great Depression and WW2, the ratio broadly remained in this range until the 1970s. “
“The trend then broke: the three decades that followed were marked by a sharp increase in the volume of bank credit relative to GDP. Bank lending on average roughly doubled relative to GDP between 1980 and 2010 as average bank credit to GDP increased from 61% to 114%. Put differently, the data dramatically underscore the expansion in credit that preceded the Global Financial Crisis of 2008. Even so, this is only a lower-bound estimate of the size of this recent credit boom; it excludes credit creation by the shadow banking system, which was significant in some countries, notably the U.S. and the U.K.”

“While both…mortgage and nonmortgage lending…experienced rapid growth in the post-WW2 era, the share of mortgages relative to other types of lending grew from a low point of less than 20% in the 1920s to the nearly 60% in the Great Recession.”