
As risk perceptions and risk aversion are fluctuating overtime, so should equity premia. This is a basis for the predictability of equity returns, even in an efficient market. A new Bank of England paper provides evidence that equity returns are indeed predictable by using two classical frameworks: the dividend discount model and multi-indicator vector autoregression.
Chin, Michael and Christopher Polk (2015), “A forecast evaluation of expected equity return measures”, Bank of England Working Paper No. 520
http://www.bankofengland.co.uk/research/Documents/workingpapers/2015/wp520.pdf
The below are excerpts from the paper. Emphasis and cursive text has been added.
“The expected return on the aggregate equity market is an important concept in asset pricing and macroeconomics, as it reflects perceptions of aggregate risk and risk-aversion, and is directly related to firms’ cost of capital and household wealth. ..A consequence of time-varying expected returns is that they allow for the presence of predictability within the equity market, and there is a large related literature examining aggregate return predictability [even in the presence of information efficiency and rational expectations]…studies argue that the improvements in forecast performance arise due to the fact that their forecasting models better capture expected returns [as opposed to information advantage].”
Two traditional equity return forecast models
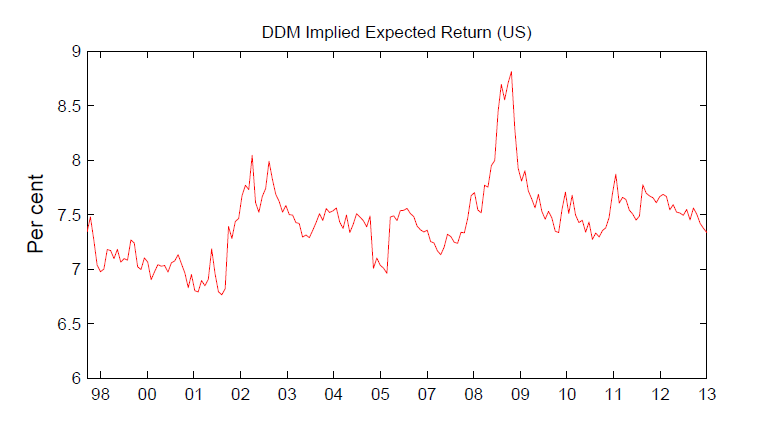
The dividend discount model
“The first approach also uses the Gordon (1962) dividend discount model framework…This approach uses analyst forecasts of future dividends in a present-value formula, and solves for the expected return used to discount these cash flows by residual.”
“There are many ways to implement this version of the model empirically. The majority of applications, however, tend to explicitly model the path of expected dividends over two to three years…Specifically, we use aggregate I/B/E/S growth rate forecasts for years 1 to 3 to calculate the level of expected dividends over these three years. We then assume that year 4 earnings grow at the average of the year 3 growth rate and the I/B/E/S medium term growth rate. Year 6 growth is set equal to a long-run growth assumption of 5%, which allows calculation of a perpetuity starting at this point in time. The final Year 6 cash flow is valued using the constant growth perpetuity formula…By assuming that the discount rate is constant at each maturity, we can solve for the implied discount rate numerically.”
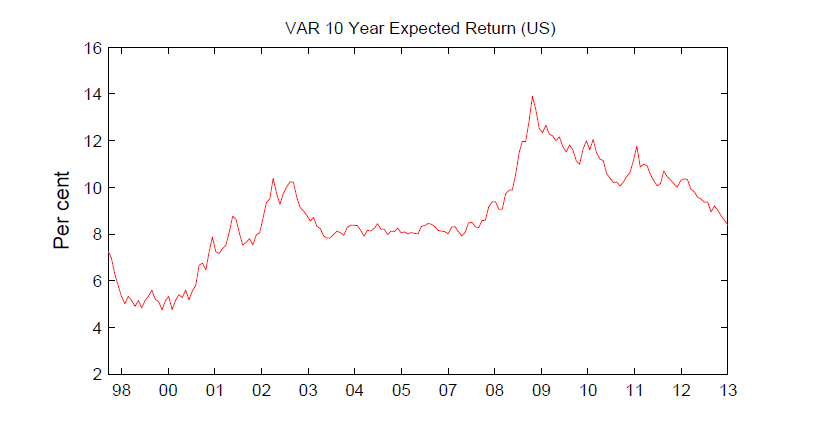
Vector autoregression (with range of forecast variables)
“The second approach models the short-run dynamics of equity returns in a Vector Autoregression [VAR. a model that captures the linear relations of time series across the series and across time] originally proposed in Campbell (1991), which is more commonly used to decompose equity returns into cash flow and discount rate news. The discount rate news in these studies simply reflects changes to the expected return forecasts made by the VAR, and this expected return estimate is the focus of our study. The VAR approach can be thought of as combining information in a range of individual forecast variables.”
“In addition to the market return, we include variables in the VAR that have been shown to forecast equity returns, and that are commonly used in applications of this framework…
- We include a smoothed dividend-price ratio, defined as the index price at timescaled by the trailing average of 10 year earnings…
- We include the term spread, defined as the 10-year constant maturity government bond yield less the yield on the 3-month Treasury bill…
- In the US VAR, we include a default spread defined as the difference between BAA and AAA corporate bond yields…
- For the UK model, due to the short sample of available data for the UK default spread, we include a pay-out ratio, defined as the ratio of aggregate dividends paid to aggregate earnings over the past twelve months, another commonly used predictive variable.”
Empirical evidence for predictability
Design and data
“We examine the predictive power of these estimates in a range of in- and out-of-sample tests, and also consider their forecasting performance against commonly used predictors such as the dividend-price ratio and term spread.”
“We use UK and US data to examine the forecasting performance of the range of variables over short and long forecast horizons (from three months to three years)…The data that enter the VAR are obtained from Global Financial Data (GFD). The data are monthly frequency, and values are taken at the end of the month. Returns are calculated from total return equity indices for the FTSE All-Share and the S&P 500, where returns on these indices include reinvested dividend payments from constituent firms…”
“We use I/B/E/S analyst forecasts in the dividend discount model…Due to the short sample…our forecast tests are limited to data from August 1998 to December 2013, while the variables that enter the VAR estimations and other predictive regressions are available further back in time. For the UK, our sample starts in January 1965 and ends in December 2013. For the US, we use data from January 1978 to December 2013.”
In-sample predictive power
“We initially consider each forecasting variable individually, and run thorough statistical tests of their predictive power. Here, we find that the dividend discount model and VAR expected return measures perform well, whereas the more traditional predictors do not.”
“The results from the UK and US VAR models…are in line with what one might expect, and with past evidence. For both the UK and US, there is a small degree of momentum in short-term returns, shown by the positive coefficient on the lagged return. The price-earnings ratios and default spread negatively predict returns, and the pay-out ratio has a positive coefficient.”
Out-of-sample forecasting power
“We consider how these predictors would have done in `real-time’, where we imagine we had to generate forecasts on a month-by-month basis using only information available to us at the time of making each forecast. Previous work has found that forecasting performance is often very weak…it has been shown that one can achieve better forecast performance by simply using the past average return…In contrast, we show that our expected returns estimates perform better compared to this simple rule, in particular when forecasting returns at longer horizons.”
“The dividend discount model and VAR may offer improvements upon traditional predictor variables to the extent that they better account for cash flow expectations, and combine information contained in a range of model inputs. The larger reduction in forecast errors of the two models in the US suggests that this extra sophistication does indeed lead to forecast improvements. This is less the case in the UK, however, where dividend-price and price-earnings ratios perform similarly well against the historical average. Overall, the out-of-sample analysis provides evidence in favour of return predictability.”