
The surge in housing prices in metropolitan China is a systemic concern. A new paper estimates that price growth has been 8-13% per year from 2003 to 2013, comparable to the 1980s housing boom in Japan. Housing prices have averaged 8 times the annual income of buyers, implying a heavy financial burden. Sustainability relies on ongoing high household income growth and low real interest rates.
Fang, Hanming, Quanlin Gu, Wei Xiong, and Li‐An ZhouLinks (2015), “Demystifying the Chinese Housing Boom”, April 2015
http://conference.nber.org/confer/2015/Macro15/Fang_Gu_Xiong_Zhou.pdf
For a broader review of China’s financial vulnerabilities view post here.
The below are excerpts from the paper. Heading, highlighting and cursive text have been added.
Key facts of China’s housing price boom
“We construct housing price indices for 120 major cities in China in 2003‐2013 based on sequential sales of new homes within the same housing developments. Our price indices confirm enormous housing price appreciation. “
“In first‐tier cities, which include the four most populated and most economically important metropolitan areas in China‐‐ Beijing, Shanghai, Guangzhou, and Shenzhen‐‐ housing prices had an average annual real growth rate of 13.1 percent during this decade…Housing prices in second‐tier cities had an average annual real growth rate of 10.5 percent; third‐tier cities had an average annual real growth rate of 7.9 percent. These growth rates easily surpass the housing price appreciation during the U.S. housing bubble in the 2000s and are comparable to that during the Japanese housing bubble in the 1980s.”
“The price‐to‐income ratio started at a level slightly above 8 across the three tiers of cities in 2003. In first‐tier cities, this ratio remained at around 8 before 2008 and then climbed to a peak of 10.7 in 2011 before dropping back to 9.2 in 2012. In second‐ and third‐tier cities, this ratio was very similar and remained in a tight range around 8… A price‐to‐income ratio of 8 or higher…implies substantial financial burdens on the borrowers.”
“It is useful to compare the price‐to‐income ratios observed in Chinese cities with [bubble periods]. Home purchases by Wall Street employees and lawyers in the U.S. consistently used price‐to‐income ratios around 3 before, during, and after the U.S. housing bubble that peaked in 2006…It is common for financial advisors in the U.S. to advise households to purchase homes with price‐to‐income ratios of around 3. During the Japanese housing bubble…the average ratio of condominium price to annual income, i.e., the income of an average household which may or may not be a home buyer, in Tokyo rose to 8.6 in 1989.”
On evidence of oversupply of residential property in China view post here.
History and institutional background
“The development of housing markets in mainland China is a relatively new phenomenon. From the 1949 founding of the People’s Republic of China to 1978, all land was publicly owned and the Chinese constitution prohibited any organization or individual from buying, selling, leasing, or transferring land…An important milestone occurred in 1988 when the Chinese constitution was amended to allow for land transactions, which set the legal stage for the privatization of housing…Comprehensive housing reform was initiated in 1994 when employees in the state sector were allowed to purchase full or partial property rights to their current apartment units at subsidized prices. Nascent markets for homes, known as ‘commodity houses’ emerged.?
“In 1998, partly as a response to the adverse effects of the 1997 Asian Financial Crisis, the Chinese government established the real estate sector as a new engine of economic growth. As an important impetus to the development of private housing markets, China’s central bank, the People’s Bank of China (PBC), outlined the procedures for home buyers to obtain residential mortgages at subsidized interest rates in 1998.Moreover, between 1998 and 2002, the PBC lowered the mortgage interest rate five times to encourage home purchases. By 2005, China had become the largest residential mortgage market in Asia.”
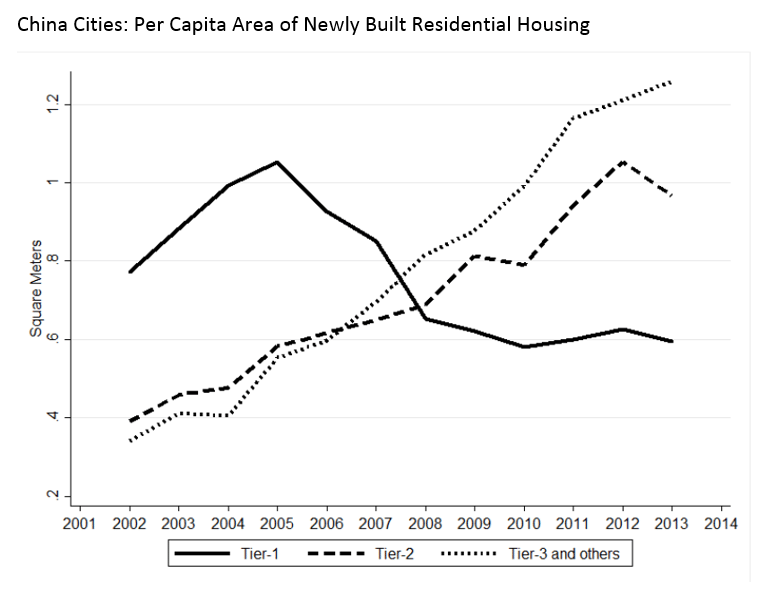
“[The graph below] provides a rough estimate of the supply of newly completed residential housing from 2002‐2013 by city tier, measured by completed areas in each city and each year divided by the city’s urban population in 2012.”
The bubble risk
“Despite the enormous price appreciation, the Chinese housing boom is different in nature from the housing bubbles in the U.S. and Japan. Our analysis offers several important observations…
- First, as banks in China imposed down payments of over 30 percent on all mortgage loans, banks are protected from mortgage borrowers’ default risk even in the event of a sizable housing market meltdown of 30 percent… The high levels of mortgage down payment used by Chinese borrowers were in sharp contrast to the popular use of zero down payment loans and negative amortization loans during the U.S. housing bubble of 2000s.
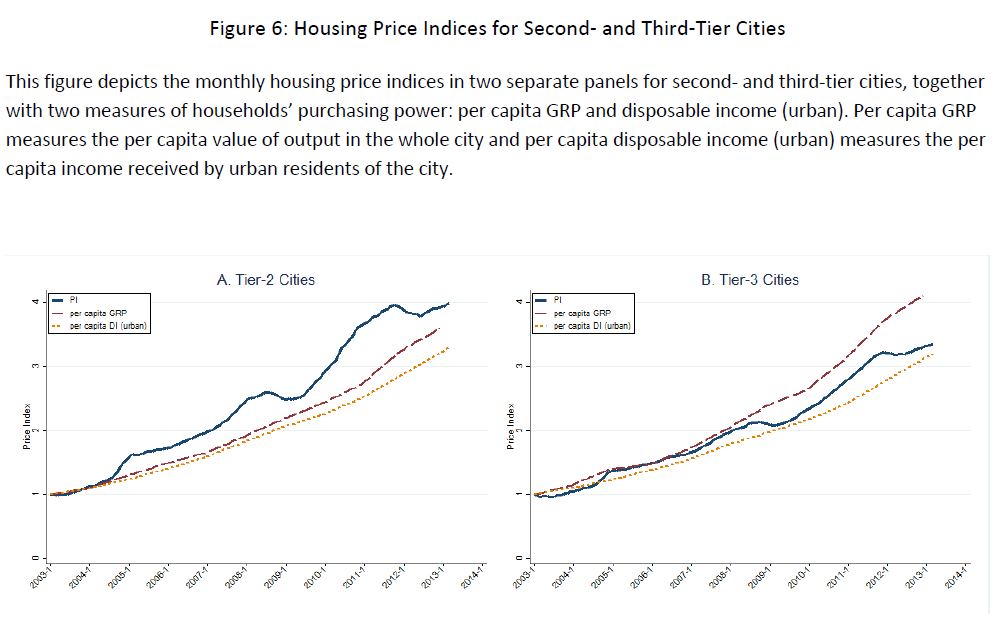
- Second, while the rapid housing price appreciation has been often highlighted as a concern for the Chinese housing market, the price appreciation was accompanied by equally spectacular growth in households’ disposable income‐‐‐an average annual real growth rate of about 9.0 percent throughout the country during the decade, with the exception of a lower average growth rate of 6.6 percent in the first‐tier cities…By contrast [in Japan] the dramatic divergence of the land price index from the per capita GDP before 1990 and the subsequent convergence vividly illustrates the widely recognized…housing bubble.”
“Frictions in the Chinese financial system might also have contributed to the high housing prices…Bank deposit accounts have remained the predominant investment vehicle with assets totaling near 100 trillion RMB in 2013, despite the fact that the real one‐year deposit rate averaged only 0.01 percent in 2003‐2013. While the Chinese stock market experienced dramatic growth during this decade, it was still relatively small, with a capitalization of slightly less than 20 trillion RMB in 2013. The size of bond markets was even smaller. Facing this largely constrained investment set, it has been common for households to treat housing as an alternative investment vehicle, which also helps explain their willingness to pay dearly for housing.”
On the risks emanating from financial repression, overinvestment and imbalances view post here.
The income issue
“A household paid eight times its annual disposable income to buy a home. In order to obtain a mortgage loan, it had to make a down payment of at least 30 percent, and more typically 40 percent, of the home price, which was equivalent to 2.4 times to 3.2 times the household’s annual income. Suppose that the household made a down payment of 40 percent and took a mortgage loan for the other 60 percent of the home price, which would be 4.8 times its annual income. A modest mortgage rate of 6 percent, which is low relative to the actual rate observed during the decade, would require the household to use nearly 30 percent of its annual income to pay for the interest on the mortgage loan. Furthermore, paying the mortgage would consume another 16 percent of its annual income used a linear amortization even if the mortgage had a maximum maturity of 30 years. Together, buying the home entailed saving 3.2 times the annual household income to make the down payment and another 45 percent of its annual income to service the mortgage loan.”
“At a 10 percent nominal income growth rate, a household’s income in five years would grow to 1.6 times of its initial income and the ratio of current housing price to its future income in five years would drop to five. Thus, a high expected income growth rate renders the aforementioned financial burdens temporary.”
“High expectation of future income growth, which might have been a key driver of the observed enormous price‐to‐income ratios, may not be sustainable and thus presents an important source of risk to the housing market. When China’s growth rate eventually regresses to the mean, and especially when China experiences a sudden stop, households’ expectations may crash. In such a case, the large price‐to‐income ratios have substantial room to contract, which in turn could act as an amplifier of the initial shock that triggers the economic slowdown.”
Some facts on the importance of the housing sector
“According to a PBC report published in 2013, financial institutions made a total of 8.1 trillion RMB in mortgage loans in 2012, accounting for 16 percent of all bank loans in that year.
“Some estimates suggest that investment to residential housing accounted for 25 percent of total fixed asset investment and contributed to roughly one‐sixth of China’s GDP growth.”
“The share of land revenues in city fiscal budgets…at the national level…started at 68% in 2003 and decreased to 42% in 2008, only to bounce back to even higher than 70% in 2010 and 2011. Across these tiers, the share is relatively low for first‐tier cities as their municipal governments have more sources of revenues, but high for second‐tier and other cities. For the cities outside the first‐ and second‐tiers, revenue from land sales was particularly high, contributing over 90% of their fiscal budgets in some years, such as 2003 and 2010.”
“The central government has also allowed the local governments to create a unique funding mechanism known as Local Government‐Backed Investment Units, through which future land sales revenue can be pledged as collateral. Local governments have used such investment units to access capital markets and issue bonds that would allow more large‐scale infrastructure/capital investment, as well as other economic development and social insurance initiatives. This unique mixing of local governmental fiscal policies with local housing markets implies that a substantial drop in housing or land prices might lead to financial distress of local governments or even trigger defaults by Local Government‐Backed Investment Units,”
On the systemic risk arising from China’s local government debt view post here.