Cross-asset correlation has remained high in recent years, despite the post-crisis decrease in volatility. Typically, correlation surges during financial crises, when macro risk factors dominate across markets. However, J.P. Morgan’s Marko Kolanovic and Bram Kaplan show that there has also been a secular increase in cross-asset correlation since 1990, due probably to globalization of markets, risk management and alpha generation techniques.
Update on Cross-Asset Correlations – J.P. Morgan North America Equity Derivatives & Quantitative Strategy, 10 April 2013
(The below quotes are from J.P. Morgan proprietary research. For the original research report please contact J.P. Morgan.)
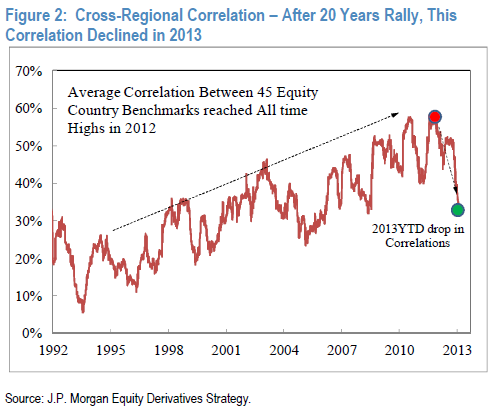
“The average level of correlations across asset classes has more than doubled from around 20% in 1990 to roughly 50% over the past five years. While a large part of the correlation increase was due to macro volatility in the wake of the global financial crisis, cross-asset correlation has been on a secular rise due to changes in market structure. Integration of global economies and financial markets, and new risk management and alpha extraction techniques have all contributed to a rise in cross-asset correlation levels.”
“High levels of correlation usually point to a common source of risk for asset prices. In times of high macro uncertainty, the prices of equities, risky bonds, oil, gold, and emerging market currencies are largely driven by changes in the macroeconomic outlook. Over the past decade, investors witnessed a significant increase of correlation between equities as well as other risky assets such as credit, foreign exchange, interest rates, and commodities.”
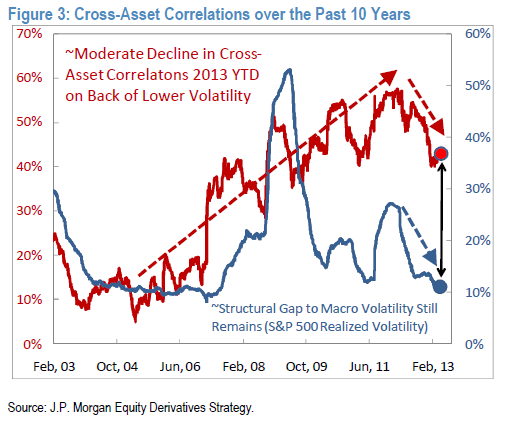
“Cross-asset correlation is proportional to levels of macro volatility and shows cyclical behavior… Structurally, cross-asset correlations rise due to investment trends such as increased use of index products. Extraction of alpha from the market via various arbitrage strategies such as statistical arbitrage, index arbitrage, capital structure.. also tend to increase levels of correlation.”
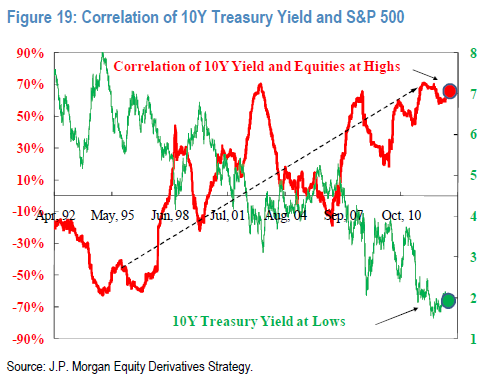
“[Through 2013] cross-asset correlations remain high, with a substantial gap above current levels of volatility Particularly high are indicators of the macro environment such as rate-equity, oil-equity, and Euro-equity correlations. This suggests that despite the decline of correlations, we may still be in a macro regime characterized by uncertain growth, dependence of asset prices on central bank liquidity, and continued overhang of the European debt crisis.”