
Understanding statistical learning is critical in modern markets, even for non-quants. Statistical learning works with complex datasets to forecast returns or to estimate the impact of specific events. The choice of methods is key: they range from simple regression to complex machine learning. Simplicity can deliver superior returns if it avoids “overfitting” (gearing models excessively to specific past experiences). Success must be measured in “out-of-sample” predictive power, after a model has been selected and estimated.
James, Gareth, Daniela Witten, Trevor Hastie and Robert Tibshirani (2014), “An Introduction to Statistical Learning with Applications in R”, Springer Texts in Statistics.
Free pdf download on: http://www-bcf.usc.edu/~gareth/ISL/
Slides and course lecture videos on Kevin Markham’s excellent post:
http://www.r-bloggers.com/in-depth-introduction-to-machine-learning-in-15-hours-of-expert-videos/
The below are excerpts from the book. Headings and cursive text have been added. Also formulas and letters of the original book text have been replaced with verbal descriptions for ease of reading
What is statistical learning?
“Statistical learning refers to a set of tools for modeling and understanding complex datasets. It is a recently developed area in statistics and blends with parallel developments in computer science and, in particular, machine learning. The field encompasses many methods…Though the term statistical learning is fairly new many of the concepts that underlie the field were developed long ago.”
What is the purpose statistical learning?
“The systematic data relation is some fixed but unknown function of observable data and a random error term, which is independent of the data and has a mean zero…There are two main reasons why we may wish to estimate a model of systematic data relation: prediction and inference.”
“In [prediction]…the estimated systematic data relation is often treated as a black box, in the sense that one is not typically concerned with the exact form…provided that it yields accurate predictions…The accuracy of estimated output as a prediction for actual output depends on two quantities…the reducible error and the irreducible error…
- In general, the estimated model of systematic data relations will not be a perfect estimate for the actual relations, and this inaccuracy will introduce some error. This error is reducible because we can potentially improve the accuracy of the estimated model by using the most appropriate statistical learning technique…
- However, even if it were possible to form a perfect estimate so that our estimated response was based on the true relation…our prediction would still have some error in it! This is because the output is also a function of the random error term, which, by definition, cannot be predicted…This is known as the irreducible error, because no matter how well we estimate…we cannot reduce the error…[which] may contain unmeasured variables that are useful in predicting the output.”
“[For inference] we instead want to understand…how a response changes as a function of the predictors. Now the estimated systematic data relation cannot be treated as a black box, because we need to know its exact form. In this setting, one may be interested in answering the following questions:
- Which predictors are associated with the response? It is often the case that only a small fraction of the available predictors are substantially associated…
- What is the relationship between the response and each predictor? Some predictors may have a positive relationship…other predictors may have the opposite relationship… the relationship between the response and a given predictor may also depend on the values of the other predictors.
- Can the relationship…be adequately summarized using a linear equation, or is the relationship more complicated? Historically, most methods…have taken a linear form.”
What methods can we choose from?
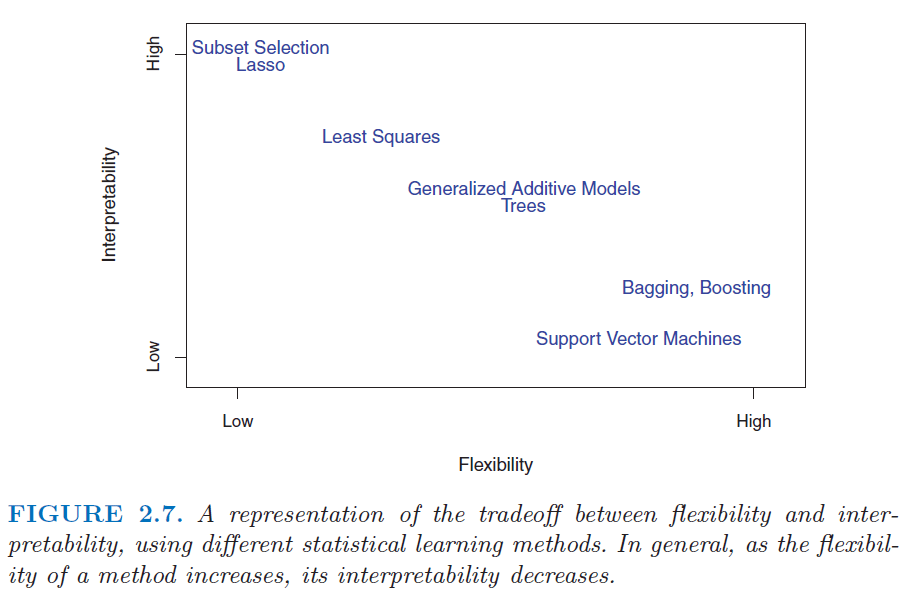
“Depending on whether our ultimate goal is prediction, inference, or a combination of the two, different methods for estimating the systematic data relation may be appropriate. For example, linear models allow for relatively simple and interpretable inference, but may not yield as accurate predictions as some other approaches. In contrast…highly non-linear approaches….provide quite accurate predictions…but this comes at the expense of a less interpretable model for which inference is more challenging.”
“Of the many methods…some are less flexible, or more restrictive, in the sense that they can produce just a relatively small range of shapes to estimate the systematic data relation.
- For example, linear regression is a relatively inflexible approach, because it can only generate linear functions…
- The LASSO [Least Absolute Shrinkage and Selection Operator]…relies upon the linear model but…is more restrictive in estimating the coefficients, and sets a number of them to exactly zero. In this sense the lasso is a less flexible approach than linear regression. It is also more interpretable than linear regression, because in the final model the response variable will only be related to a small subset of the predictors—namely, those with nonzero coefficient estimates.
- Generalized additive models (GAMs)…instead extend the linear model to allow for certain non-linear relationships. Consequently, GAMs are more flexible than linear regression. They are also somewhat less interpretable than linear regression, because the relationship between each predictor and the response is now modelled using a curve.
- Fully non-linear methods such as bagging [machine learning meta-algorithms designed to improve the stability and accuracy of machine learning algorithms], boosting [machine learning meta-algorithms for reducing bias primarily and also variance], and support vector machines with non-linear kernels [learning models with associated learning algorithms that analyze data and recognize patterns]… are highly flexible approaches that are harder to interpret.”
“One might reasonably ask the following question: why would we ever choose to use a more restrictive method instead of a very flexible approach? There are several reasons that we might prefer a more restrictive model. If we are mainly interested in inference, then restrictive models are much more interpretable. For instance, when inference is the goal, the linear model may be a good choice since it will be quite easy to understand the relationship between output and individual predictors. In contrast, very flexible approaches, such as the splines…and the boosting method…can lead to such complicated estimates of the systematic data relation that it is difficult to understand how any individual predictor is associated with the response.”
“If we seek to develop an algorithm to predict the price of a stock, our sole requirement for the algorithm is that it predict accurately— interpretability is not a concern. In this setting, we might expect that it will be best to use the most flexible model available. Surprisingly, this is not always the case! We will often obtain more accurate predictions using a less flexible method. This phenomenon, which may seem counterintuitive at first glance, has to do with the potential for overfitting in highly flexible methods… which essentially means they follow the errors, or noise, too closely… the fit obtained will not yield accurate estimates of the response on new observations that were not part of the original training data set.”
How do we choose the right learning method?
“There is no free lunch in statistics: no one method dominates all others over all possible data sets… Selecting the best approach can be one of the most challenging parts of performing statistical learning in practice.”
“In order to evaluate the performance of a statistical learning method on a given data set, we need some way to measure how well its predictions actually match the observed data. That is, we need to quantify the extent to which the predicted response value for a given observation is close to the true response value for that observation. In the regression setting, the most commonly-used measure is the mean squared error [the average squared distance between actual output and prediction].”
“In general, we do not really care how well the method works training on the training data [in the sample that has been used for model selection and estimation]. Rather, we are interested in the accuracy of the pre dictions that we obtain when we apply our method to previously unseen test data [a dataset that has not been used for model estimation]…Suppose that we are interested test data in developing an algorithm to predict a stock’s price based on previous stock returns. We can train the method using stock returns from the past 6 months. But we don’t really care how well our method predicts last week’s stock price. We instead care about how well it will predict tomorrow’s price or next month’s price.”
“What if no test observations are available? In that case, one might imagine simply selecting a statistical learning method that minimizes the training MSE [means squared error for the data upon the model has been fitted]. This seems like it might be a sensible approach, since the training MSE and the test MSE appear to be closely related. Unfortunately, there is a fundamental problem with this strategy: there is no guarantee that the method with the lowest training MSE will also have the lowest test MSE. Roughly speaking, the problem is that many statistical methods specifically estimate coefficients so as to minimize the training set MSE. For these methods, the training set MSE can be quite small, but the test MSE [when the estimate is applied out of sample] is often much larger.”
“[The figure below] illustrates this phenomenon on a simple example. In the left-hand panel…we have generated observations the true systematic data relation given by the black curve. The orange, blue and green curves illustrate three possible estimates…obtained using methods with increasing levels of flexibility. The orange line is the linear regression fit, which is relatively inflexible. The blue and green curves were produced using smoothing splines… The green curve is the most flexible and matches the data very well; however, we observe that it fits the true systematic data relation (shown in black) poorly because it is too wiggly… A more restricted and hence smoother curve has fewer degrees of freedom than a wiggly curve…Linear regression is at the most restrictive end, with two degrees of freedom.”
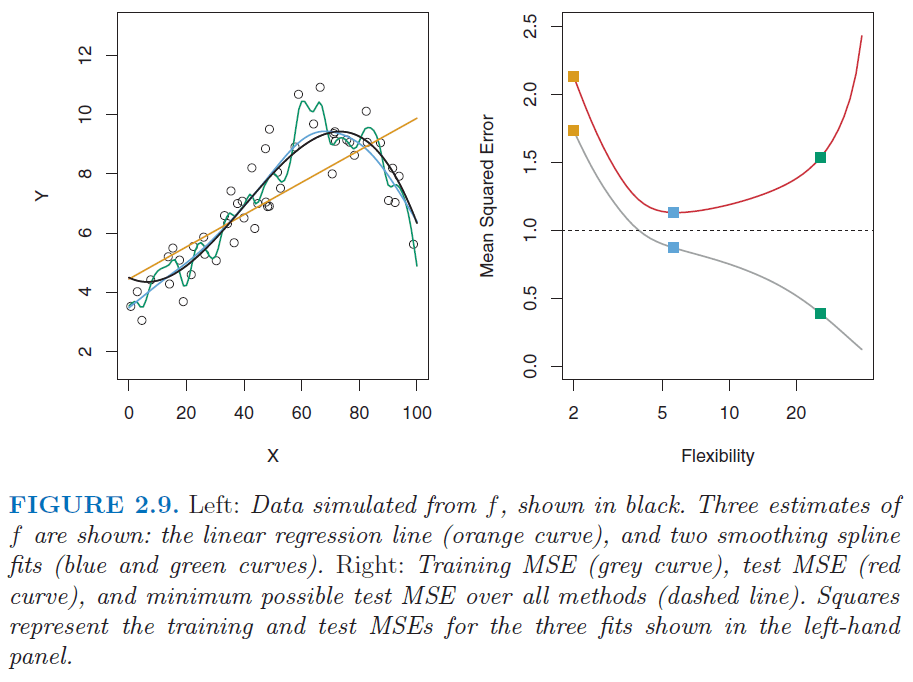
“As the flexibility of the statistical learning method increases, we observe a monotone decrease in the training MSE and a U-shape in the test MSE. This is a fundamental property of statistical learning that holds regardless of the particular data set at hand and regardless of the statistical method being used. As model flexibility increases, training MSE will decrease, but the test MSE may not.”
“When a given method yields a small training MSE but a large test MSE, we are said to be overfitting the data. This happens because our statistical learning procedure is working too hard to find patterns in the training data, and may be picking up some patterns that are just caused by random chance rather than by true properties of the unknown function. When we overfit the training data, the test MSE will be very large because the supposed patterns that the method found in the training data simply don’t exist in the test data…Overfitting refers specifically to the case in which a less flexible model would have yielded a smaller test MSE.”
“Note that regardless of whether or not overfitting has occurred, we almost always expect the training MSE [in-sample] to be smaller than the test MSE [out-of-sample] because most statistical learning methods either directly or indirectly seek to minimize the training MSE.”
What is the bias-variance trade-off?
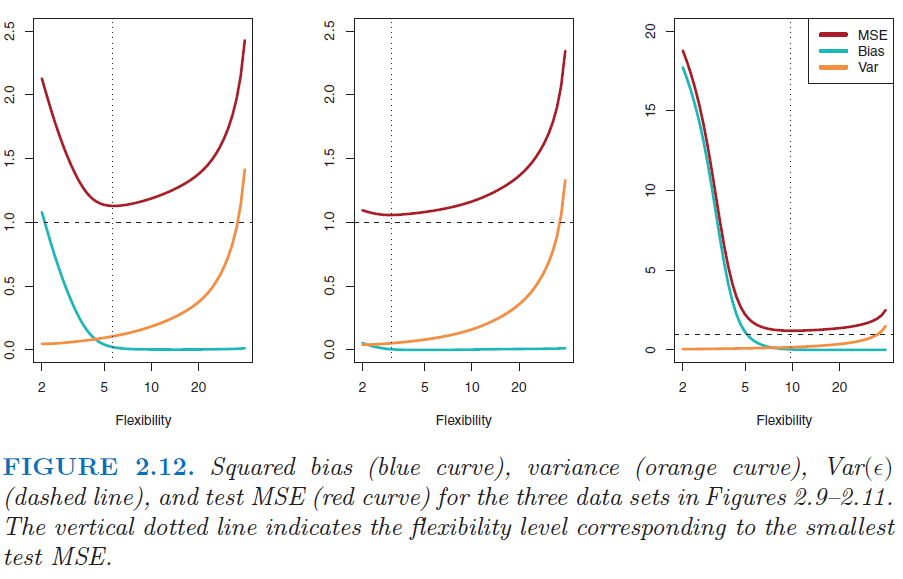
“[There are] two competing properties of statistical learning methods…The expected test mean squared error (that we would obtain if we repeatedly estimated test MSE using a large number of training sets)…can always be decomposed into the sum of three fundamental quantities:
- the variance of the estimated systematic data relation,
- the squared bias of the estimated relation, and
- the variance of the random error term.”
“In order to minimize the expected test error, we need to select a statistical learning method that simultaneously achieves low variance and low bias…
- Variance refers to the amount by which the estimated systematic data relation would change if we estimated it using a different training data set…Ideally the estimate for the systematic data relation should not vary too much between training sets…If a method has high variance then small changes in the training data can result in large changes in the estimated systematic data relation. In general, more flexible statistical methods have higher variance. ..
- Bias refers to the error that is introduced by approximating a real-life problem, which may be extremely complicated, by a much simpler model. For example, linear regression assumes that there is a linear relationship…It is unlikely that any real-life problem truly has such a simple linear relationship, and so performing linear regression will undoubtedly result in some bias…no matter how many training observations we are given, it will not be possible to produce an accurate estimate using linear regression…Generally, more flexible methods result in less bias.”
“As a general rule, as we use more flexible methods, the variance will increase and the bias will decrease. The relative rate of change of these two quantities determines whether the test MSE increases or decreases. As we increase the flexibility of a class of methods, the bias tends to initially decrease faster than the variance increases. Consequently, the expected test MSE declines. However, at some point increasing flexibility has little impact on the bias but starts to significantly increase the variance. When this happens the test MSE increases.”
“The relationship between bias, variance, and test set MSE is referred to as the bias-variance trade-off. Good test set performance of a statistical learning method re quires low variance as well as low squared bias.”
Annex 1: Supervised versus unsupervised statistical learning
“[Statistical learning] tools can be classified as supervised or unsupervised. Broadly speaking, supervised statistical learning involves building a statistical model for predicting, or estimating, an output [say equity returns] based on one or more inputs [such as trend, valuation or economic data]. With unsupervised statistical learning, there are inputs but no supervising output; nevertheless we can learn relationships and structure from such data [such as similarity or joint factor dependence of various asset returns].”
Annex 2: Parametric versus non-parametric estimates
“Our goal is to apply a statistical learning method to the training data [the available dataset that is used for estimation] in order to estimate the unknown systematic data relation… Most statistical learning methods for this task can be characterized as either parametric or non-parametric.
- Parametric methods involve a two-step model-based approach… First, we make an assumption about the functional form… After a model has been selected, we need a procedure that uses the training data to fit or train the model… The most common approach to fitting is referred to as (ordinary) least squares…The potential disadvantage of a parametric approach is that the model we choose will usually not match the true unknown form…If the chosen model is too far from the true systematic data relation, then our estimate will be poor.
- Non-parametric methods do not make explicit assumptions about the functional form of the systematic data relation. Instead they seek an estimate…that gets as close to the data points as possible without being too rough or wiggly. Such approaches can have a major advantage over parametric approaches: by avoiding the assumption of a particular functional form…they have the potential to accurately fit a wider range of possible shapes…But non-parametric approaches do suffer from a major disadvantage: since they do not reduce the problem of estimating…to a small number of parameters, a very large number of observations (far more than is typically needed for a parametric approach) is required in order to obtain an accurate estimate.”